bulkrna
dalmolingroup/bulkrna: Output
Introduction
This document describes the output produced by the pipeline. Most of the plots are taken from the MultiQC report, which summarises results at the end of the pipeline.
The directories listed below will be created in the results directory after the pipeline has finished. All paths are relative to the top-level results directory.
Pipeline overview
The pipeline is built using Nextflow and processes data using the following steps:
- FastQC - Raw read QC
- fastp - fastp reports (in HTML and JSON) about the trimming process
- FastQC_trimmed - Trimmed read QC - will be included in MultiQC results
- Kallisto - Kallisto quantification results
- TxImport - Aggregate quantification results at gene and transcript levels
- MultiQC - Aggregate report describing results and QC from the whole pipeline
- Pipeline information - Report metrics generated during the workflow execution
FastQC
Output files
fastqc/*_fastqc.html: FastQC report containing quality metrics.*_fastqc.zip: Zip archive containing the FastQC report, tab-delimited data file and plot images.
FastQC gives general quality metrics about your sequenced reads. It provides information about the quality score distribution across your reads, per base sequence content (%A/T/G/C), adapter contamination and overrepresented sequences. For further reading and documentation see the FastQC help pages.
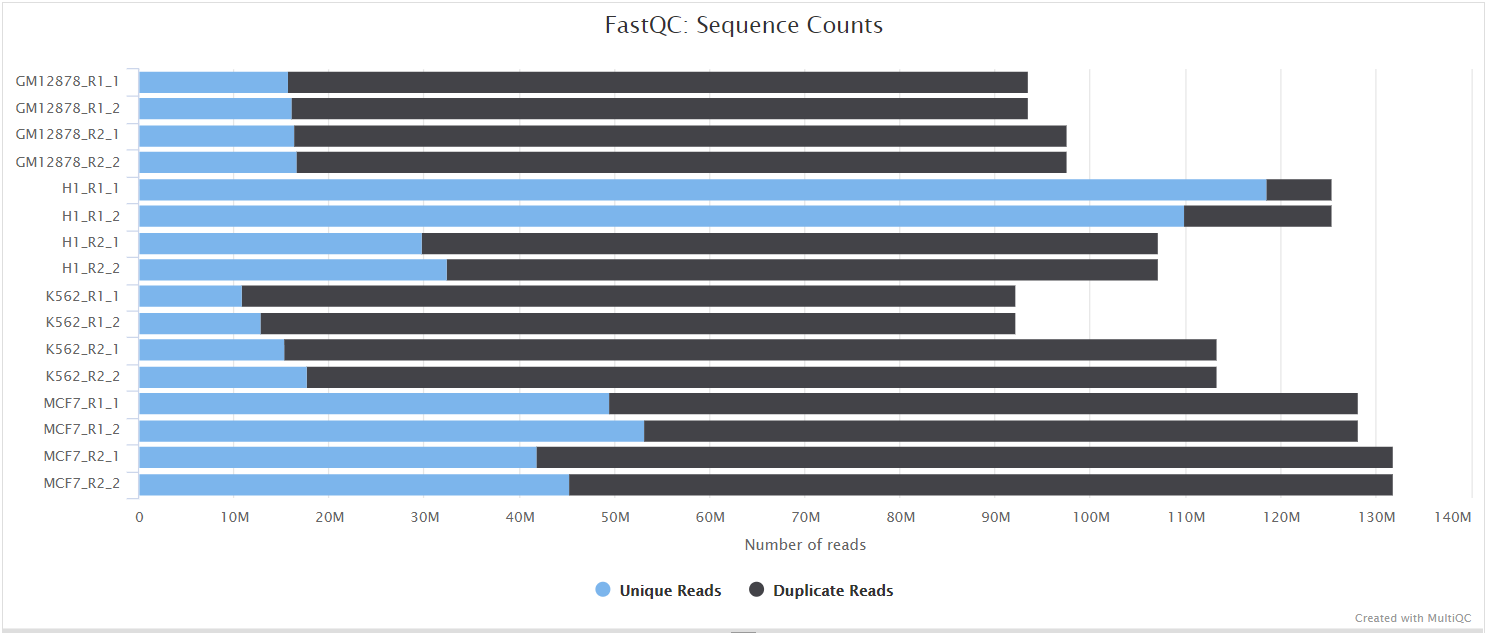
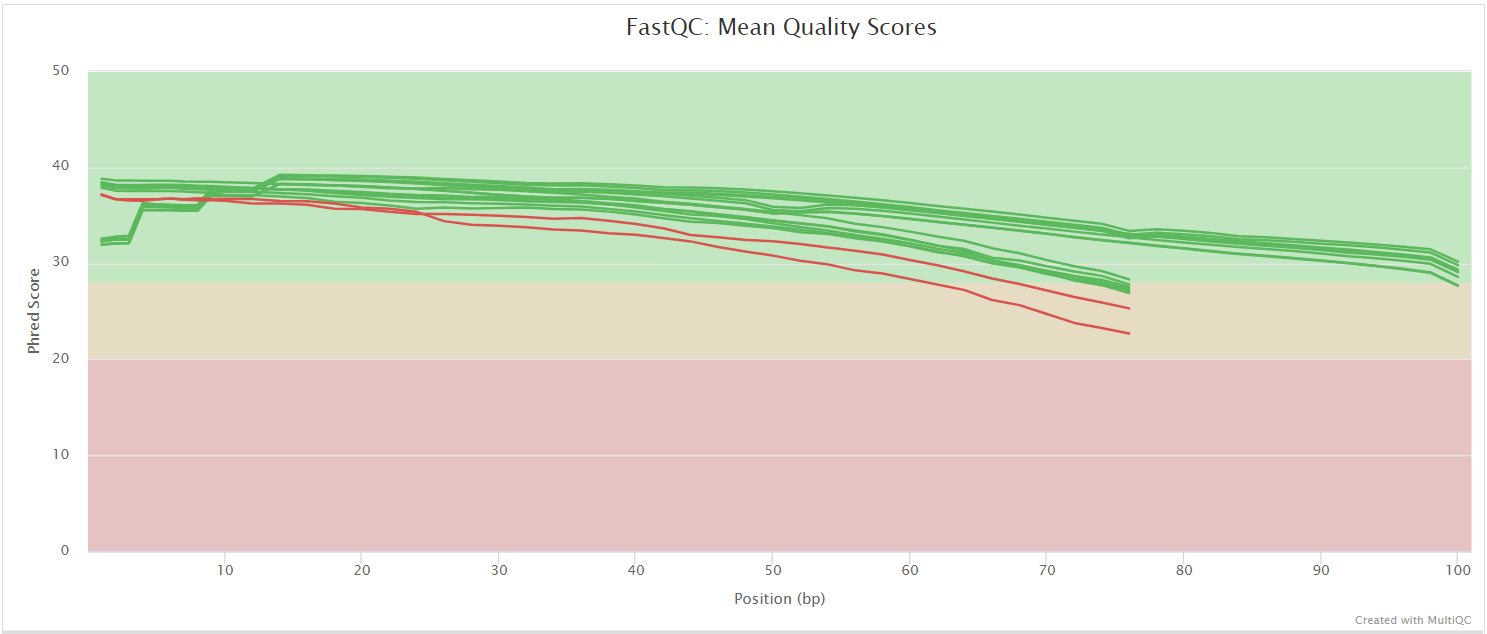
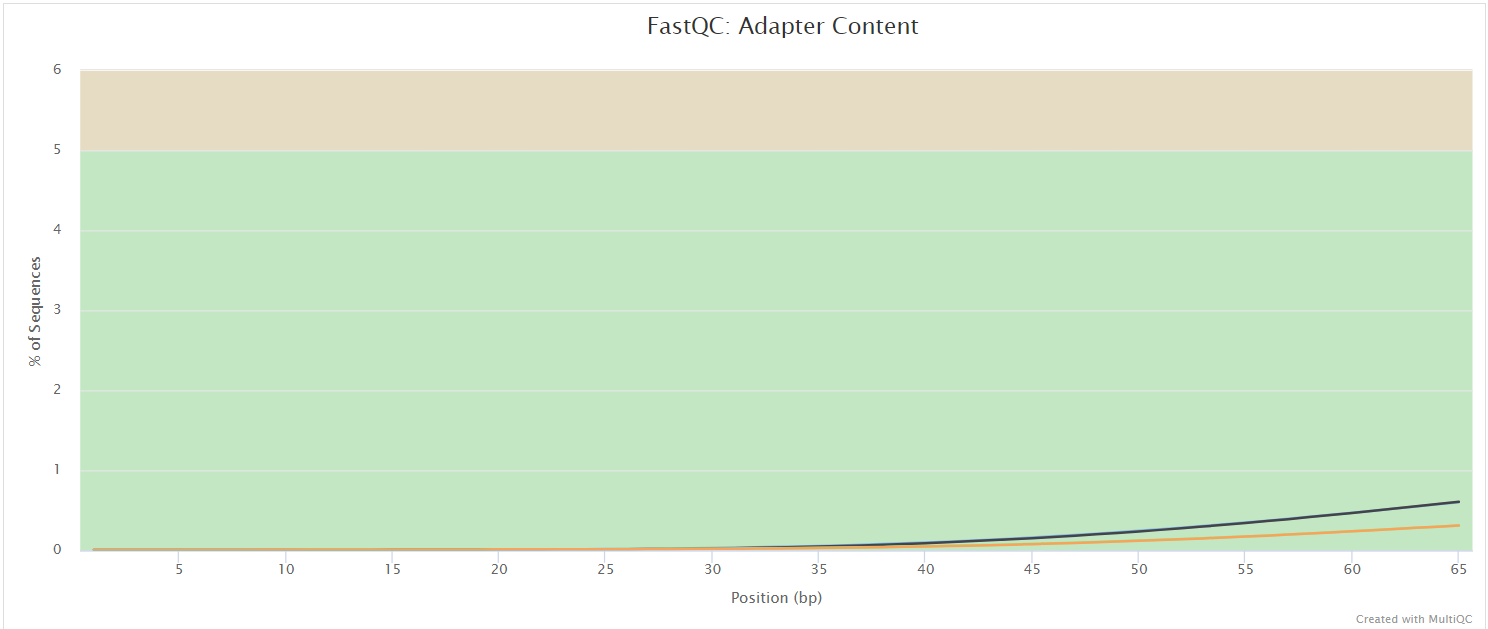
NB: The FastQC plots displayed in the MultiQC report shows trimmed reads (see fastp).
fastp
fastp is an ultra-fast all-in-one FASTQ preprocessor. Used in this workflow for adapter trimming and low-quality sequence removal.
fastp*.html- HTML report generated by fastp*.json- JSON report generated by fastp
Kallisto
kallisto is used here
for aligning and quantifying targets against a reference transcriptome.
kallisto{sample_id}- Abundances quantified from said sample
TxImport
tximport is used here
to summarize transcript and gene-level counts from Kallisto.
tximportgene_tpm.tsv- Gene-level estimates (transcript-per-million) for the samplesgene_counts.tsv- Gene-level estimates (raw counts) for the samplestranscript_tpm.tsv- Transcript-level estimates (transcript-per-million) for the samplestranscript_counts.tsv- Transcript-level estimates (raw counts) for the samplestranscript_scaled_tpm.tsv- Transcript-level estimates (transcript-per-million) for the samples, scaled up to library size (scaledTPM)transcript_scaled_counts.tsv- Transcript-level estimates (raw counts) for the samples, scaled up to library size (scaledTPM)
MultiQC
Output files
multiqc/multiqc_report.html: a standalone HTML file that can be viewed in your web browser.multiqc_data/: directory containing parsed statistics from the different tools used in the pipeline.multiqc_plots/: directory containing static images from the report in various formats.
MultiQC is a visualization tool that generates a single HTML report summarising all samples in your project. Most of the pipeline QC results are visualised in the report and further statistics are available in the report data directory.
Results generated by MultiQC collate pipeline QC from supported tools e.g. FastQC. The pipeline has special steps which also allow the software versions to be reported in the MultiQC output for future traceability. For more information about how to use MultiQC reports, see http://multiqc.info.
Pipeline information
Output files
pipeline_info/- Reports generated by Nextflow:
execution_report.html,execution_timeline.html,execution_trace.txtandpipeline_dag.dot/pipeline_dag.svg. - Reports generated by the pipeline:
pipeline_report.html,pipeline_report.txtandsoftware_versions.yml. Thepipeline_report*files will only be present if the--email/--email_on_failparameter’s are used when running the pipeline. - Reformatted samplesheet files used as input to the pipeline:
samplesheet.valid.csv.
- Reports generated by Nextflow:
Nextflow provides excellent functionality for generating various reports relevant to the running and execution of the pipeline. This will allow you to troubleshoot errors with the running of the pipeline, and also provide you with other information such as launch commands, run times and resource usage.