Evolution of biological systems
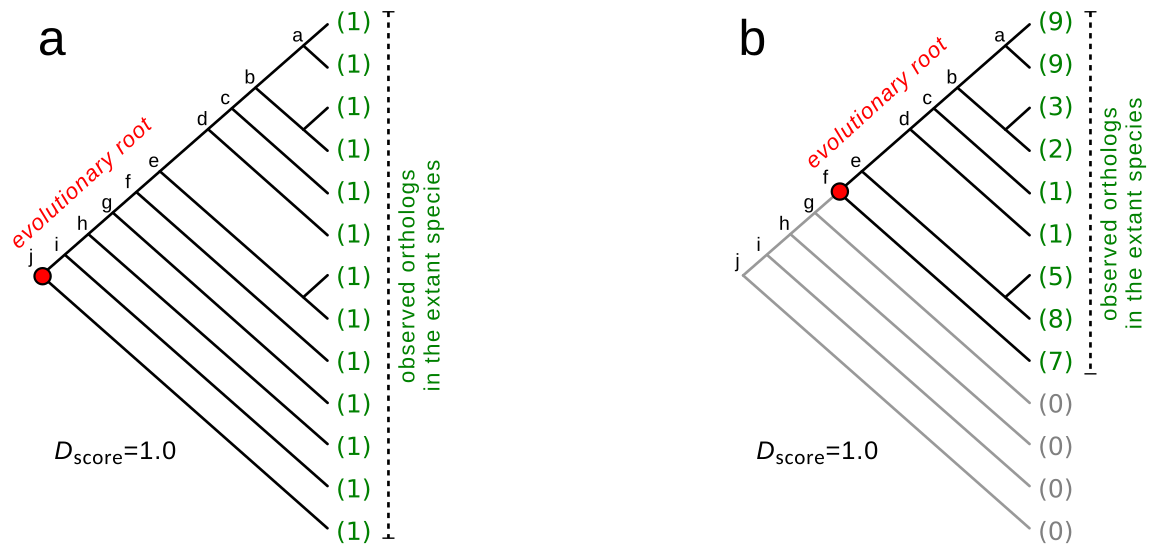
An algorithm to infer the evolutionary root of orthologous groups
The development of sequencing technologies in the past two decades allowed the study of the phylogenetic relationship of several model organisms. An interesting question relies on the mechanisms behind how new genes arise and how they interact and evolve together to build the intricate network of genes observed in the organism’s biochemical pathways. Gene duplication is highlighted as a crucial event in genome evolution, offering a prime source for genetic material and allowing evolutionary forces to generate novelty. In the Dalmolin et al, 2011 paper, the importance of duplication events in the evolutionary history of orthologous groups is assessed by the ratio of components to the number of organisms with items from the group. The study extends to analyze Eukaryotic Clusters of Orthologous Groups (KOG) in STRING, evaluating the evolutionary plasticity and conservation of groups based on component distribution across eukaryotic genomes, proposing an equation for plasticity, and identifying correlations between evolutionary distance and plasticity. The algorithm used in this paper to infer the evolutionary root of orthologous groups, based on a phylogenetic tree from eukaryotes, is implemented as an R/Bioconductor package called geneplast.
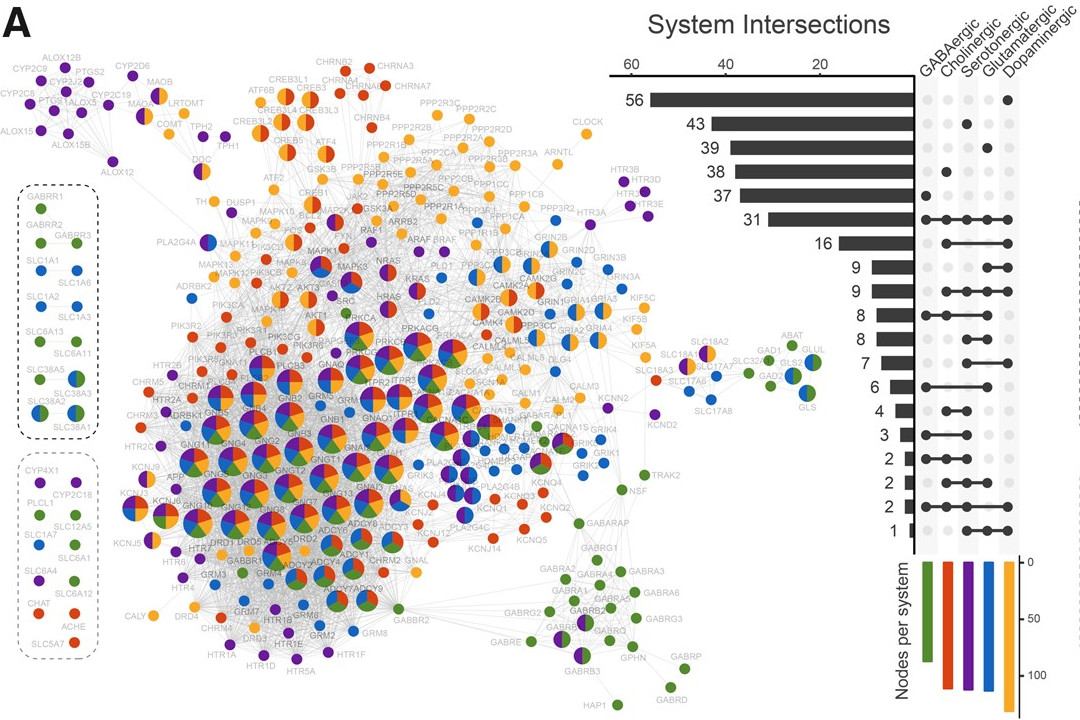
This approach was used to unravel the evolution of biochemical systems, such as human synapses
In the Viscardi et al. 2020 paper, we aimed to reconstruct the evolutionary history of the human neurotransmission gene network by analyzing genes in major neurotransmitter systems. The findings suggest that the emergence of receptor families, particularly ionotropic receptors, at the Human–Cnidaria Last Common Ancestor played a crucial role in the evolution of synapses, even before their establishment in Ctenophores.
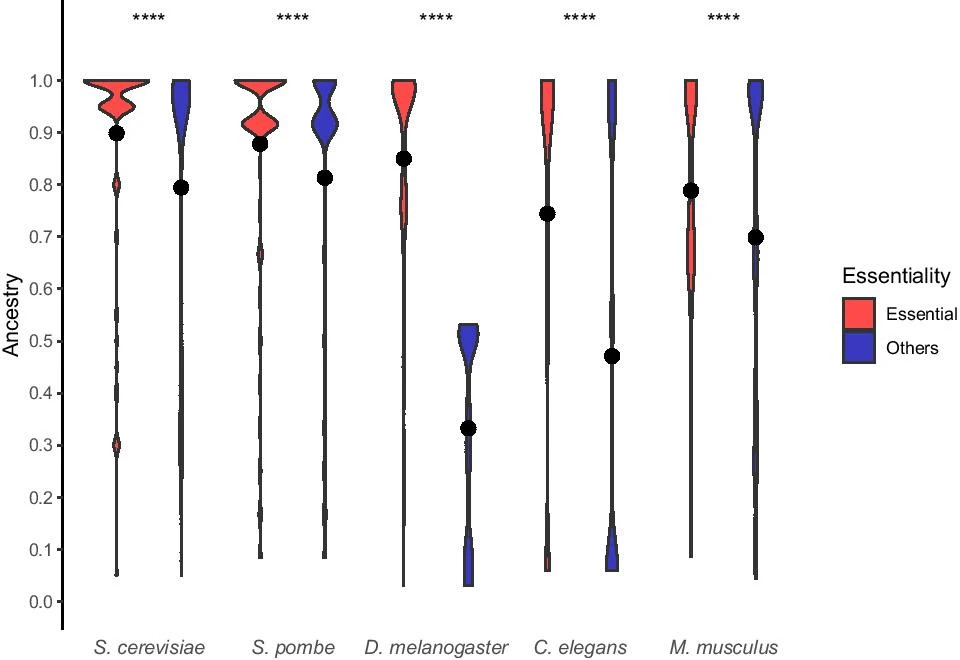
And essential genes
In De Souza et al, 2021 paper, essential genes from five model eukaryotes were analyzed to determine if they differ in age from non-essential genes. The study compared network properties and investigated the biological functions of essential genes in each species, revealing that essential genes are rooted in different evolutionary periods. Despite varying origins, essential genes tend to be older and more connected than other genes across all evaluated model species.