Analysis of biological networks
Biological Network Analysis is a dynamic and interdisciplinary field that allows the integration and interpretation of complex biological information through the analysis of interactions among biological entities, be they genes, proteins, metabolites, or other molecules. This approach has enabled the identification of key biological components, regulatory mechanisms and functional modules involved in biological pathways and diseases.
The Dalmolin Group has been using biological network analysis to uncover biological mechanisms since 2008. The first work was an integration between Protein-Protein Interactions network and orthology, resulting in an orthology map in order to locate the eukaryotic genes in the human apoptosis and genome-stability gene/protein-association network (Castro et al, 2008). Subsequently, this approach was used to model gene networks based on transcriptional data that responds selectively to both hypoxia and acidosis (Dalmolin et al, 2012).
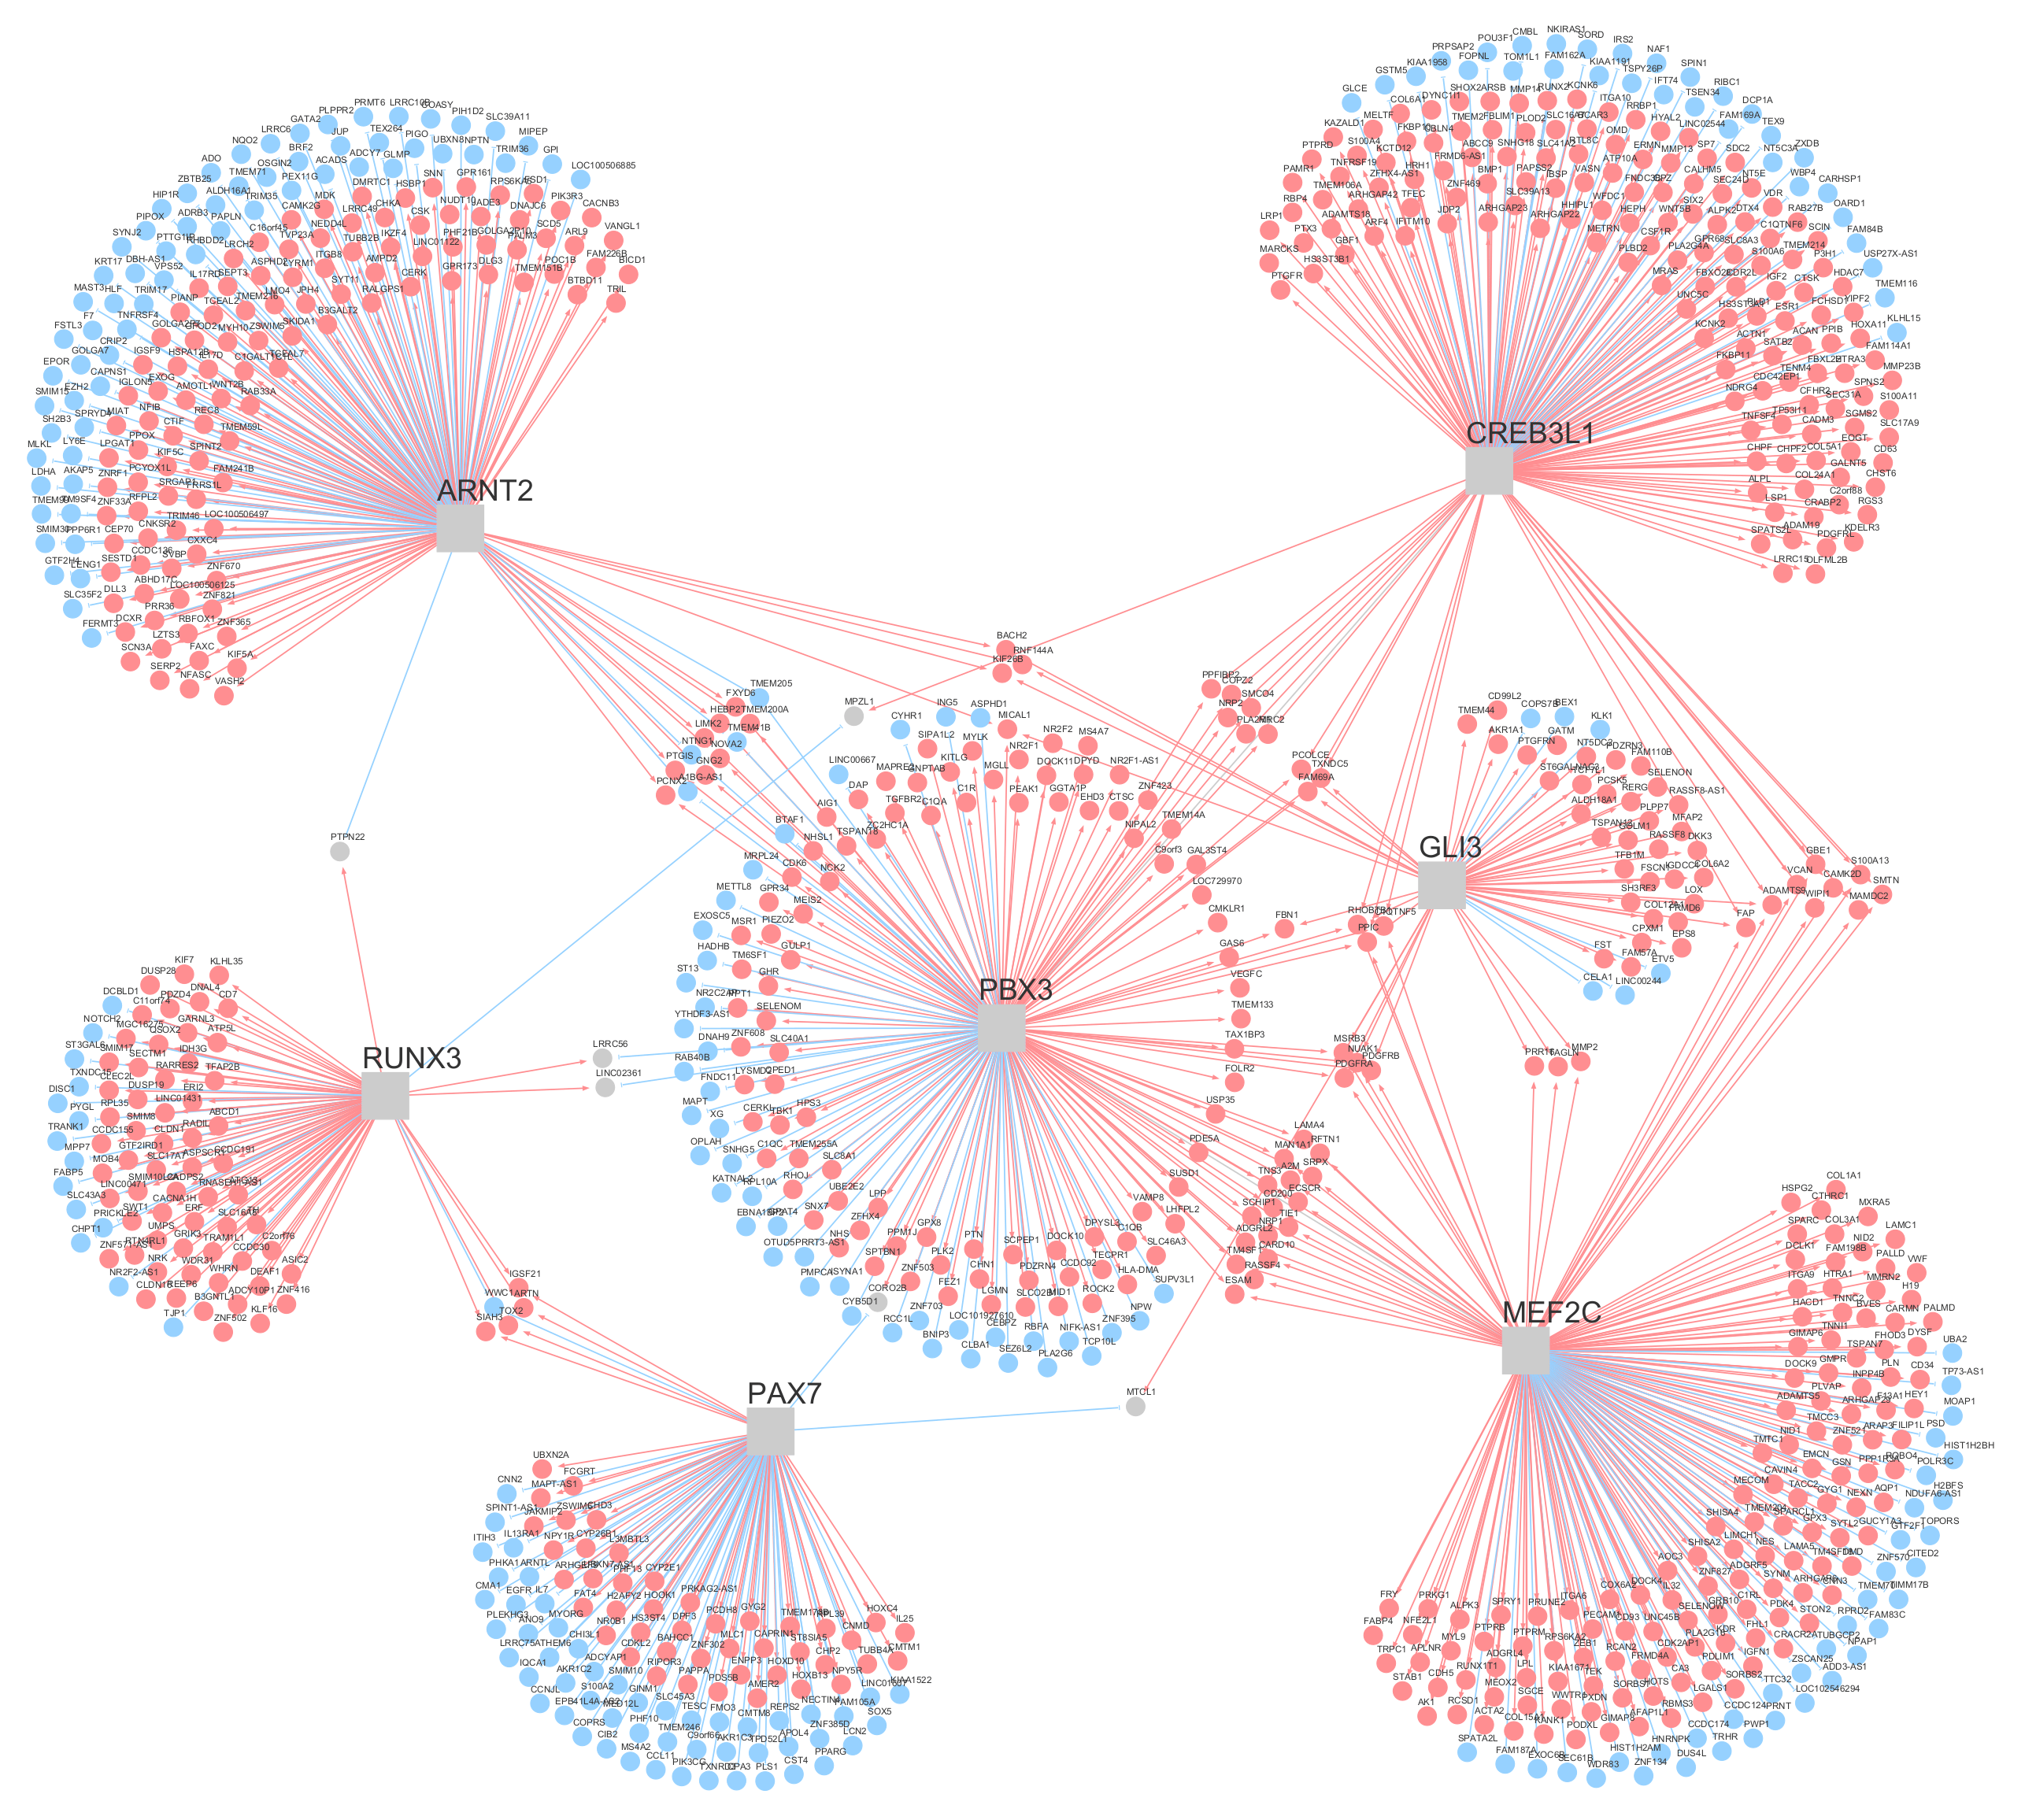
Over the last decade, the group has been exploring a tool that builds networks based on regulatory units (The RTN package) with the aim of modeling transcriptional networks and identifying master regulators associated with the investigated phenotypes. This method has helped us understand the global regulome and identify regulators responsible for triggering several diseases, including Ewing Sarcoma (Ribeiro-Dantas et al, 2021), Neuroblastoma (Albanus et al, 2013), Pediatric Sepsis (Oliveira et al, 2021), and metastatic prostate cancer (Ferraz et al, 2023). Our perspective for the coming years is to explore the regulatory network at the cellular level, investigating the gene interactions that occur cell to cell.
