Transcriptional analyses
What is Transcriptomics?
Transcriptional analysis is an indispensable tool for understanding the pattern and regulation of gene expression in triggering biological processes. This field has been marked by notable advances in molecular biology techniques over the years and, consequently, in the amount of data generated. The Dalmolin group has been researching this area since 2009, analyzing data from Microarray, Bulk RNA-seq, and, more recently, single-cell RNA-seq (scRNA-seq).
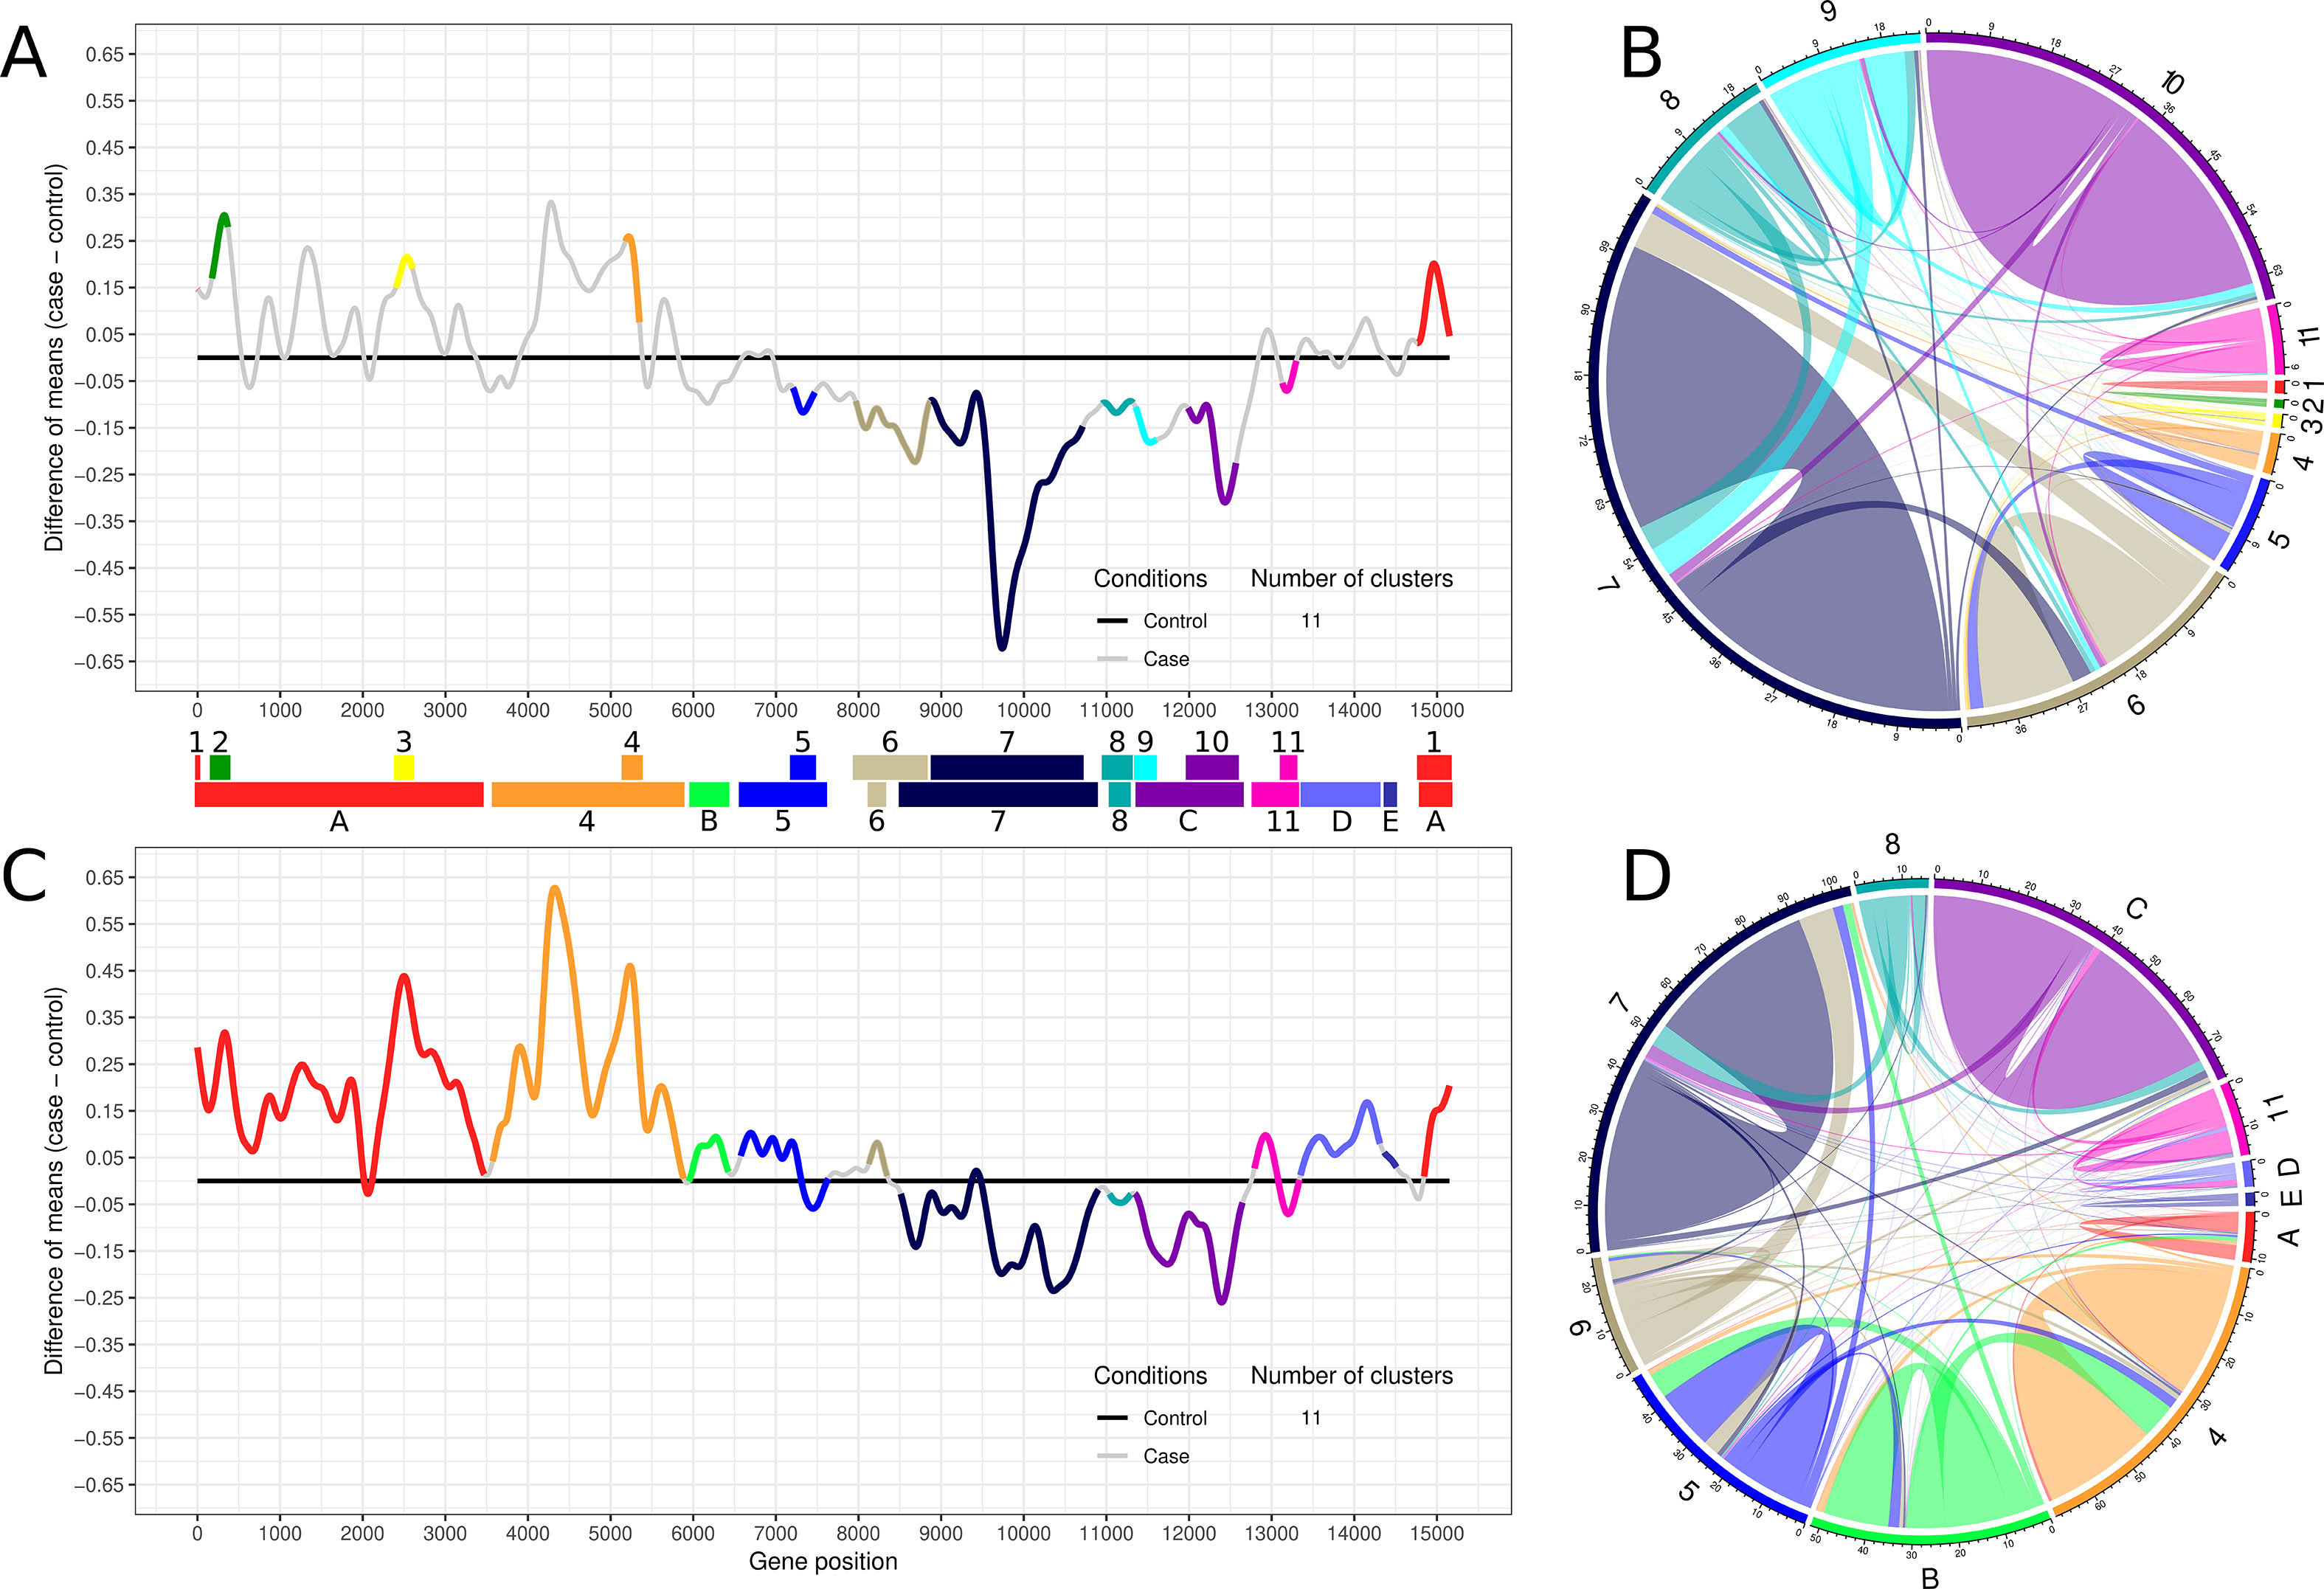
One of the first transcriptional analysis projects undertaken by the group resulted in the development of a computational method that assesses gene expression variation and identifies functional modules consisting of strongly interacting genes. Initially, this method was applied to differentiate stages of Saccharomyces cerevisiae fermentation (Rybarczyk-Filho et al, 2011), and, subsequently, it was used to assess early and late-induced global transcriptional changes caused by lead intoxication (Reis et al, 2019). This approach resulted in the Bioconductor/R package called Transcriptogramer (Morais et al, 2019) and can be used for both Microarray and RNA-seq data, enabling genome-wide visualization of the alterations in the gene expression in various conditions or diseases.
The group also conducts studies focusing on the transcriptional analysis applied to diseases, studying the gene expression pattern related to the regulation of metastasis development in cancer and major depressive disorder.